Why does your site pass Core Web Vitals in your home market but fail in Nigeria? Why does PageSpeed Insights show green while Google Search Console flags the same page as Poor? And why does your LCP look acceptable in a London lab test but collapse on a mid-range Android in Jakarta?
These are not edge-case questions. For any website serving users across multiple countries, Core Web Vitals performance is inherently uneven. The technical thresholds are fixed. The conditions under which real users experience your site are not.
This article builds a structured understanding of Core Web Vitals for global websites — how the signal system works, where and why scores diverge across markets, which tools to use at each stage of analysis, and how to prioritize optimization by market impact rather than average score.
| KEY TAKEAWAYS |
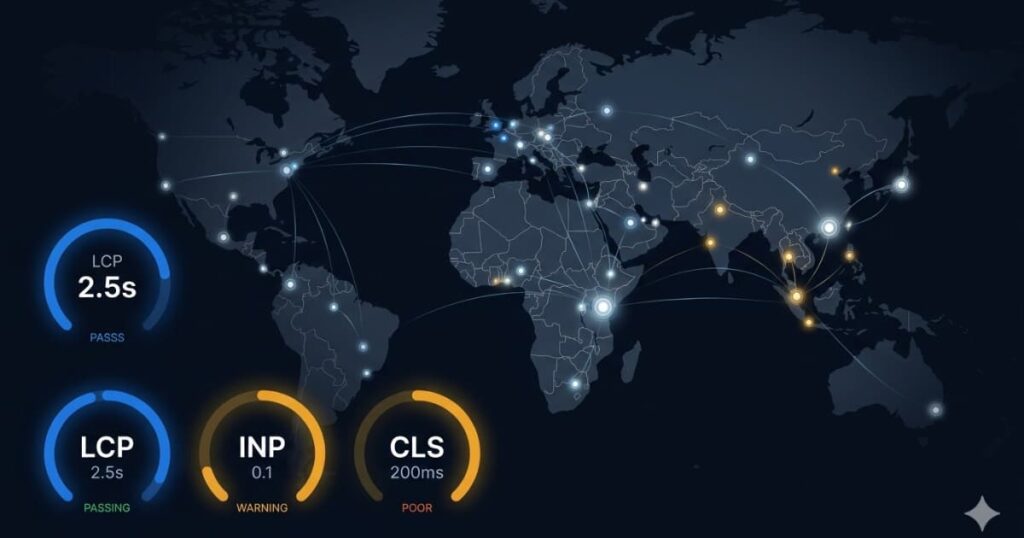
| Core Web Vitals are not a single metric — they are a three-signal system (LCP, INP, CLS) measuring real user experience at scale. |
| Global performance diverges because network conditions, device capabilities, and CDN coverage vary significantly across markets. |
| Lab tools measure controlled conditions. Real User Monitoring (RUM) via CrUX measures actual field experience. Both are required. |
| A 100ms LCP improvement on 3G in Lagos produces greater business impact than the same gain on fiber in London — drop-off is steeper at lower baselines. |
| Core Web Vitals scores are market-specific. A Good score in one region is often Needs Improvement in another. |
What Core Web Vitals Actually Measure
Core Web Vitals are a set of three user-experience signals that Google has defined as measurable proxies for real-world page quality. Introduced in 2020 and confirmed as ranking signals in 2021 via the Page Experience update, they each isolate a distinct dimension of how a user experiences a page load and interaction cycle.
| Metric | What It Measures | Good | Poor | Primary Driver |
| LCP | Time to render the largest visible content element | 2.5s | > 4.0s | Server TTFB, render-blocking resources, image size |
| INP | Responsiveness to all page interactions through the session | 200ms | > 500ms | JavaScript thread blocking, event handler efficiency |
| CLS | Visual stability — unexpected layout shifts | 0.1 | > 0.25 | Missing image dimensions, late fonts, injected content |
What Core Web Vitals Do Not Measure
Core Web Vitals do not measure total page load time, time-to-first-byte in isolation, DOM size, or JavaScript bundle weight directly. These are inputs that influence CWV scores, but they are not the scores themselves. Conflating them is a common source of optimization misdirection.
A technically heavy page can pass Core Web Vitals if it loads the largest element quickly, avoids layout shifts, and handles interactions responsively. A lightweight page can fail if fonts block render or injected ads shift content after load.
Why Core Web Vitals Performance Varies Across Global Markets
Core Web Vitals scores are not universal. The same URL produces different field scores in different markets because the signals measure real-user experience — and real-user conditions are fundamentally different across geographies. Three structural variables drive this divergence.
1. Network Latency and Connection Quality
LCP is highly sensitive to server response time (TTFB) and the network round-trip required to fetch render-critical resources. On a 4G LTE connection with 30ms latency, a 2MB hero image may load in 1.8 seconds. On a variable 3G connection with 200ms latency, the same image may take 5.4 seconds — a failure by nearly any threshold.
CDN placement compounds this. A CDN node in Amsterdam serves Western European users in under 20ms. The same origin may route African users to that same node, adding 180–220ms of latency before the first byte is delivered. Without edge nodes in target markets, TTFB alone can exhaust the entire LCP budget.
2. Device Capability and Rendering Power
INP measures responsiveness, which is constrained by the device’s ability to process JavaScript and execute event handlers. A site with 400KB of compressed JavaScript may respond to a tap in 80ms on a flagship device. On an entry-level Android — the majority of mobile devices in many emerging markets — the same interaction may take 600ms or more.
This is not a network problem. It is a computational ceiling problem. CDN optimization does not resolve it. JavaScript reduction, code splitting, and offloading work from the main thread are the relevant mechanisms.
3. Market-Specific CrUX Thresholds
Google’s Core Web Vitals assessment is based on the 75th percentile of field data from the Chrome User Experience Report. This means 75% of real users in that market must experience the metric within the Good threshold for a URL to pass.
In a market where 40% of users are on slow connections, passing the 75th percentile LCP threshold requires that even users with poor connectivity load your largest content element within 2.5 seconds. This is a substantially different engineering challenge than optimizing for a market where the median user is on fiber.
| Market | Avg. Connection | Device Profile | LCP Benchmark | Primary Risk |
| Western Europe / US | Fiber / 4G LTE | Mid-to-high end | ~1.8s | CLS (ad-heavy sites) |
| Nigeria / Kenya | 3G / variable 4G | Entry-to-mid range | ~4.2s | LCP (slow TTFB + image weight) |
| India (metro) | 4G LTE | Mid range | ~2.8s | INP (JS-heavy pages) |
| Indonesia | 4G (variable) | Mid-range Android | ~3.1s | LCP + CLS |
| Brazil | 4G / cable | Mid range | ~2.5s | INP on mobile |
| Japan / South Korea | Fiber + 5G | High end | ~1.5s | CLS (dynamic content) |
These benchmarks reflect CrUX field data patterns. Actual performance varies by site architecture, CDN configuration, and traffic source mix.
Testing Core Web Vitals Across Global Markets: The Tool Framework
Global Core Web Vitals analysis requires two distinct measurement types: lab testing and field measurement. Neither is sufficient on its own.
Lab Testing vs. Field Data: The Structural Difference
Lab testing simulates a user experience in a controlled environment. Tools like Lighthouse and WebPageTest load a URL with predefined connection speeds and device profiles. Lab tests are reproducible, diagnostically precise, and excellent for identifying technical bottlenecks. They do not reflect actual user conditions.
Field data measures what real users experience on their actual devices and connections. Google’s CrUX collects this passively from Chrome browsers and aggregates it into 28-day rolling windows. Field data captures the full distribution of user experience — including the slow tail that lab tests miss.
For global websites, the gap between lab and field scores is often largest in markets where devices are slower and connections are less consistent. A site that passes all Lighthouse audits may still fail CrUX thresholds in a target market.
| Tool | Type | Best For | Global Simulation | Cost |
| Google Search Console | Field (RUM) | Real-user CWV segmented by country | Yes (country view) | Free |
| PageSpeed Insights | Lab + Field | Quick per-URL audits | Partial (via API) | Free |
| Chrome UX Report | Field (RUM) | Country-level benchmarks (28-day) | Yes — by country | Free |
| Lighthouse (DevTools) | Lab | Deep technical diagnostics | Manual throttling | Free |
| WebPageTest | Lab | Multi-region test agents | Yes — global nodes | Free / Paid |
| Calibre / SpeedCurve | Lab + Field | CI/CD performance monitoring | Configurable | Paid |
| Semrush Site Audit | Lab + crawl | SEO-integrated CWV reporting | Partial | Paid |
| Benchmark Your Market Performance If your site serves multiple regions, the next step is segmenting CrUX data by country before making optimization decisions. Start with your highest-traffic markets — not your home market — to identify where performance gaps are actually costing conversions. |
Running Market-Specific Tests with WebPageTest
WebPageTest provides test agents in multiple global locations. For market-specific testing, select an agent in or near your target market and configure a connection profile reflecting local median conditions.
- Sub-Saharan Africa: Lagos or Johannesburg agent, 3G Fast profile (1.6Mbps / 150ms latency)
- South/Southeast Asia: Mumbai or Singapore agent, 4G LTE profile (9Mbps / 70ms latency)
- Latin America: Sao Paulo agent, 4G profile with mid-range Android device emulation
- Western Europe / North America: London or New York agent, cable connection profile
Run each test three to five times and use the median result. Single-run WebPageTest results carry high variance.
Extracting Market-Segmented Field Data from CrUX
The Chrome UX Report API allows you to query field data by country — the most reliable way to understand what Google is actually measuring for your URLs in each market. The API returns p75 values for LCP, INP, and CLS by country, along with distribution data showing what percentage of sessions fell into Good, Needs Improvement, and Poor bands.
Google Search Console’s Core Web Vitals report provides a similar country-segmented view within its interface, though with less granular distribution data than the API.
Optimization Frameworks by Core Web Vital
Optimization priorities differ by metric. Each CWV signal has a distinct set of root causes and a corresponding set of interventions.
Improving LCP for Global Traffic
LCP is primarily a delivery problem. The largest content element must reach the user’s viewport within 2.5 seconds at the 75th percentile. The causal chain for LCP failure almost always follows this sequence: slow TTFB — delayed discovery of render-critical resources — slow resource fetch — late render. Intervene at each stage in sequence.
- Reduce TTFB: Deploy CDN nodes in target markets. For Sub-Saharan Africa and parts of Southeast Asia, this means evaluating CDN coverage explicitly rather than assuming global networks provide adequate local presence.
- Eliminate render-blocking resources: Any synchronous CSS or JavaScript in the document head delays LCP. Defer non-critical scripts and inline critical CSS above the fold.
- Optimize the LCP element: Use WebP or AVIF image formats, serve appropriately sized images per viewport, and use fetchpriority=high on the LCP image.
- Preconnect to critical origins: Add link rel=preconnect for third-party origins that the browser must establish connections to before rendering begins.
- Implement responsive image serving: Use srcset and sizes to ensure users on smaller devices receive appropriately scaled images rather than full-resolution assets.
Improving INP for Low-Power Device Markets
INP replaced First Input Delay (FID) as a Core Web Vital in March 2024. It measures responsiveness across the full interaction lifecycle — not just the first click. INP failures in global markets are typically caused by JavaScript execution blocking the browser’s main thread.
- Audit long tasks: Use Chrome DevTools Performance panel to identify JavaScript tasks exceeding 50ms on a target-market device profile.
- Break up long tasks: Use scheduler.yield() to yield the main thread during intensive processing, allowing the browser to respond to interactions between work chunks.
- Reduce third-party JavaScript: Analytics, chat widgets, and ad tags frequently cause INP failures by occupying the main thread during interaction processing.
- Defer non-critical scripts: Scripts not required for initial interactivity should load after the page is interactive, using dynamic imports where appropriate.
Fixing CLS for Globally Variable Content
CLS measures the sum of unexpected visual shifts during page load, weighted by viewport proportion affected and distance shifted. CLS failures are often caused by elements loaded asynchronously and inserted without reserved space — particularly ad slots, images without dimensions, late-loading fonts, and dynamically injected content.
- Reserve space for all media: Set explicit width and height attributes on images and video. The browser uses this to calculate aspect ratio and reserve layout space before the resource loads.
- Reserve space for ad slots: Define fixed-height containers for ad placements. A slot that expands from 0 to 250px when the ad loads creates a measurable CLS event.
- Optimize font loading: Use font-display: optional or font-display: swap to prevent font swaps from causing reflow. Preload critical web fonts from your CDN.
- Avoid layout-triggering animations: CSS transforms and opacity changes do not cause layout shifts. Width, height, top, and left properties do.
Prioritizing Markets: Where Optimization Has Greatest Impact
For global websites, applying optimization uniformly across all markets is inefficient. The strategic question is not ‘which pages need improvement’ but ‘which market-page combinations produce the greatest business impact per optimization investment.’
This requires cross-referencing three data sets: traffic volume by market (where are your users?), revenue or conversion rate by market (where does traffic convert?), and CWV scores by market (where is performance degraded?). The highest-priority optimization targets are markets where all three converge unfavorably.
The Diminishing Returns Problem
Markets that already pass Core Web Vitals thresholds offer limited ranking or conversion benefit from further optimization. Improving LCP from 1.8s to 1.2s in a market where you already pass the 75th percentile does not change your CWV assessment. The marginal return is low.
The same effort applied to a market where LCP sits at 3.8 seconds — one second above the Good threshold — may move a meaningful percentage of sessions from Poor into Good, changing the CWV pass/fail assessment and improving ranking eligibility in that market.
Phased Market Optimization Approach
- Phase 1 — Establish baseline: Extract CrUX field data for all target markets. Identify which markets are Passing, Needs Improvement, or Failing each CWV metric.
- Phase 2 — Impact scoring: Weight each failing market by traffic volume, revenue contribution, and score distance from the Good threshold.
- Phase 3 — Technical triage: Run market-specific WebPageTest sessions for the highest-impact markets. Identify root causes per metric.
- Phase 4 — Prioritized fixes: Implement CDN and delivery improvements for LCP-failing markets first. Then address JavaScript and INP on a per-market device profile.
- Phase 5 — Monitor and iterate: Set up CrUX API monitoring for target markets. Allow 28 days for field data to reflect changes. Infrastructure improvements show in lab data within days; field scores shift over the full 28-day window.
Forward Implication: Core Web Vitals in AI-Indexed Search Environments
Google’s shift toward AI-generated search overviews introduces a structural question about how Core Web Vitals will function as ranking signals in an environment where fewer traditional organic results are served.
Current evidence suggests CWV remain relevant in two distinct ways. Pages selected as sources for AI Overview citations must be accessible and technically sound — poor Core Web Vitals scores correlate with broader technical issues that reduce crawlability. Additionally, the residual organic results below AI Overviews continue to be subject to Page Experience signals.
The emerging risk for global sites is that AI search is expanding fastest in high-GDP markets — where competition for AI Overview citations is also most intense. Sites serving mixed global audiences may face a scenario where the markets most influenced by AI search overlap with the markets where Core Web Vitals competition is fiercest.
Treating Core Web Vitals as a purely technical checklist underestimates this convergence. Sites that build genuine performance clarity across markets — not just local-market optimization — are better positioned for both traditional and AI-mediated search environments.
Structured Summary
- Core Web Vitals measure three distinct dimensions of real-user experience: load performance (LCP), interaction responsiveness (INP), and visual stability (CLS).
- Scores are market-specific because they reflect actual user conditions — network quality, device capability, and CDN coverage vary significantly by geography.
- Effective global analysis requires both lab testing (diagnostic precision) and field measurement via CrUX (real-user ground truth).
- LCP responds to delivery improvements; INP responds to JavaScript reduction and main-thread management; CLS responds to layout reservation and font handling.
- Market prioritization should be driven by the intersection of traffic volume, revenue exposure, and score gap — not global averages.
- Core Web Vitals are increasingly relevant to AI-indexed search as well as traditional organic rankings, particularly in high-competition global markets.
| Build a Market-Specific Performance Strategy Core Web Vitals optimization is only as effective as the geographic granularity of your data. MarginsEye provides structured performance audits segmented by market, with prioritization frameworks based on your traffic distribution and revenue exposure per region. Request a Market Performance Audit |
Next Read
How International SEO Architecture Affects Core Web Vitals: hreflang, CDN Structure, and Country-Specific Performance — A structural breakdown of how multi-region site architecture decisions influence CWV scores at scale.
Frequently Asked Questions
Q: Does Core Web Vitals performance affect SEO rankings globally?
Yes, as one of many ranking signals. Google uses Core Web Vitals as a tiebreaker among pages with comparable relevance signals. The weight is most significant in competitive keyword environments. Passing CWV thresholds in each target market is now considered baseline technical SEO hygiene for global sites.
Q: Why is my PageSpeed Insights score different from Search Console?
PageSpeed Insights combines a lab score (Lighthouse, run at test time) with CrUX field data for that specific URL. Search Console aggregates field data across all similar pages over 28 days, grouping URLs. Discrepancies arise because lab conditions don’t reflect real-user conditions, and URL grouping blends high- and low-traffic pages. Always prioritize field data for ranking-related decisions.
Q: Can a site pass Core Web Vitals in one country but fail in another?
Yes. Google evaluates CWV at the origin level but uses market-segmented CrUX data. If your site passes the 75th percentile LCP threshold for UK users but fails for Nigerian users, you have a market-specific performance problem — not a global one. Google Search Console’s CWV report now segments by country, making this analysis accessible without API queries.
Q: What is the most impactful single optimization for LCP in low-bandwidth markets?
CDN edge coverage in the target market. In many emerging markets, the absence of a nearby CDN node adds 150–250ms of network latency per round trip. Before optimizing images or eliminating render-blocking resources, verify that your CDN has meaningful PoP coverage in your highest-impact slow-performance markets.
Q: How long does it take for Core Web Vitals improvements to appear in field data?
CrUX data uses a 28-day rolling window. A significant improvement deployed today will take approximately 28 days to be fully reflected in field scores. Infrastructure changes improve lab scores within days but require the full 28-day window to shift p75 field data. Plan monitoring timelines accordingly.
Q: What is INP and how does it differ from FID?
Interaction to Next Paint (INP) replaced First Input Delay (FID) in March 2024. FID measured only the delay before the browser began processing the first interaction. INP measures the full responsiveness of all interactions throughout the page session — clicks, taps, and keyboard inputs — and reports the worst-performing interaction at the 75th percentile. INP is a substantially stricter and more comprehensive measure of interactivity.
Q: Should I use Lighthouse scores or CrUX data for optimization decisions?
Use both, for different purposes. Lighthouse is diagnostic — it tells you what is causing performance problems. CrUX is evaluative — it tells you how real users are experiencing your site and what Google is measuring for ranking. A common error is optimizing Lighthouse scores without verifying that improvements are reflected in field data.
Q: How does font loading affect CLS in global markets?
Web fonts loaded from a remote origin cause CLS when the browser renders the page using a system font, then replaces it with the web font after it loads — causing text reflow. This is more pronounced in high-latency markets where fonts take longer to arrive. Use font-display: optional to prevent shifts by only applying the web font when cached, or font-display: swap with preloading to minimize the shift window.
Q: Are Core Web Vitals relevant for sites that don’t rely on Google organic traffic?
For sites primarily relying on paid search, social, or direct traffic, Core Web Vitals have no direct ranking impact. However, the performance signals measured by CWV — particularly LCP and INP — correlate strongly with conversion rate and user engagement metrics. The business case for optimization exists independent of its SEO implications.
Q: What is a realistic LCP target for a site serving both European and African markets?
Targeting under 2.5 seconds globally is feasible but requires market-appropriate infrastructure. For European users on broadband, standard CDN optimization is sufficient. For African users on variable 3G/4G, this requires CDN nodes with African PoP coverage, compressed next-gen image formats, and aggressive TTFB reduction. A single performance target is appropriate. A single technical strategy for both markets is not.
