If you’ve been wondering why your website still isn’t ranking despite decent content, or why your PageSpeed score looks fine but your traffic hasn’t moved — Core Web Vitals might be where the answer lives. A lot of site owners have questions like: What exactly are Core Web Vitals measuring? Does my score in PageSpeed Insights actually affect my rankings? And why does my site feel fast on my laptop but slow for everyone else?
These are fair questions. The confusion usually comes from how Core Web Vitals are explained — most guides treat them as a simple checklist when they’re actually a continuous measurement system based on how real users experience your site.
This article breaks down what Core Web Vitals actually are, how Google measures them, what changed in 2024 (yes, one metric was replaced entirely), and what you should be doing to improve them in 2025.
Key Takeaways
- Core Web Vitals are real-user experience signals, not just speed scores — Google measures them from actual Chrome users over a 28-day window.
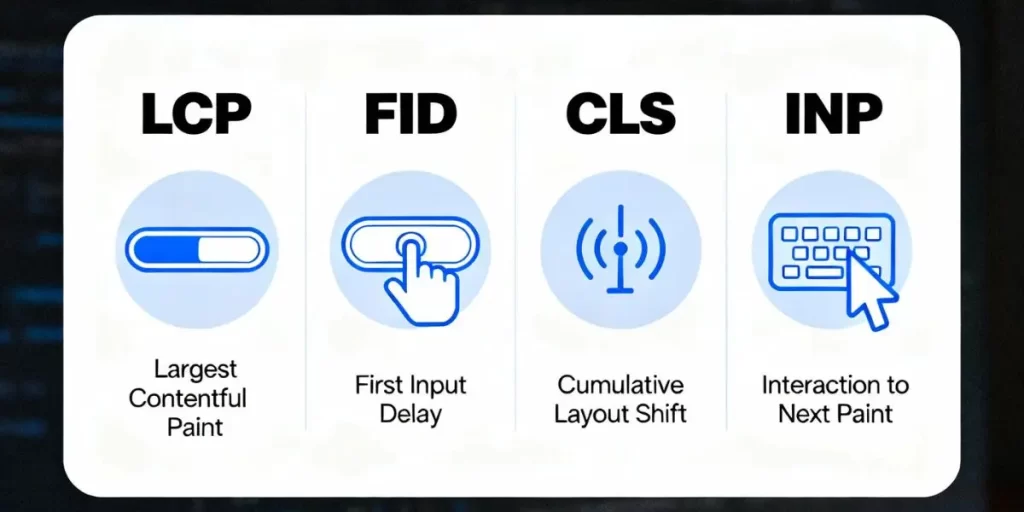
- FID (First Input Delay) was officially replaced by INP (Interaction to Next Paint) in March 2024. Optimizing for FID in 2025 is optimizing for a deprecated metric.
- Your PageSpeed Insights score and your actual Core Web Vitals ranking signal are not the same thing. One is lab data. The other is field data.
- LCP is the most impactful metric for rankings — and the most commonly misconfigured.
- Passing Core Web Vitals requires 75% of real users to experience “Good” scores, not just one clean test.
What Are Core Web Vitals — and Why Do They Affect Rankings?
Core Web Vitals are a set of performance signals that Google uses to evaluate the quality of a user’s experience on a webpage. They sit under the broader umbrella of Page Experience signals, which Google uses as a ranking factor alongside content relevance and backlinks.
The key thing most articles miss: Google doesn’t measure Core Web Vitals from lab simulations. It measures them from real Chrome users through the Chrome User Experience Report (CrUX) — a dataset that collects anonymized performance data from people actually visiting your site.
This means a “100/100” in PageSpeed Insights doesn’t automatically translate into strong Core Web Vitals ranking performance. If the people visiting your site are on slow 3G connections in rural areas or using older Android devices, their experience is what Google counts.
The threshold Google uses is the 75th percentile: for your site to pass a metric, at least 75% of your real-user sessions need to land in the “Good” zone. Not the average — the 75th percentile.
That distinction matters a lot for how you approach optimization.
The Three Core Web Vitals Metrics (Updated for 2025)
1. Largest Contentful Paint (LCP) — Loading Performance
LCP measures how long it takes for the largest visible element on the page to finish rendering. This is usually a hero image, a large heading, or a featured video thumbnail.
Why it exists: Users form an impression of page speed based on when they see the main content appear — not when the browser technically “finishes loading.” LCP captures that moment.
How it works: The browser tracks all candidate elements (images, text blocks, video posters) and records the render time of whichever one is largest in the viewport at the point of page load completion.
Thresholds:
| Score | LCP Value |
|---|---|
| Good | Under 2.5 seconds |
| Needs Improvement | 2.5 – 4.0 seconds |
| Poor | Over 4.0 seconds |
Common constraint: Lazy loading your hero image is one of the most common LCP mistakes. If you apply loading="lazy" to the image that is your LCP element, the browser deliberately delays loading it — which directly tanks your LCP score.
What actually moves LCP: Server response time (TTFB), the size and format of the LCP image, whether the image is preloaded, and whether render-blocking CSS or JavaScript is delaying the page paint.
2. Interaction to Next Paint (INP) — Responsiveness
Important update: First Input Delay (FID) was officially retired and replaced by INP in March 2024. If you’re reading a guide that still lists FID as a current Core Web Vital, that guide is outdated. INP is now the metric that matters.
INP measures the overall responsiveness of a page throughout the entire visit — not just the first interaction. It captures the delay between a user action (click, tap, keypress) and the moment the browser visually responds.
Why the change from FID to INP: FID only measured the first interaction on a page. Users don’t just interact once — they scroll, click buttons, fill out forms. INP captures the worst-case interaction latency across the full session, which is a much more honest measure of how a page feels to use.
Thresholds:
| Score | INP Value |
|---|---|
| Good | Under 200 milliseconds |
| Needs Improvement | 200 – 500 milliseconds |
| Poor | Over 500 milliseconds |
How it works: The browser measures the time between user input and the next visual frame painted in response. Long JavaScript tasks block the main thread and prevent the browser from responding — that’s the primary driver of poor INP.
Key tradeoff: Aggressively deferring JavaScript can hurt INP if critical interaction handlers are deferred. The goal isn’t to remove JavaScript — it’s to break long tasks into smaller chunks and prioritize the scripts tied to user interactions.
3. Cumulative Layout Shift (CLS) — Visual Stability
CLS measures how much the visible content on a page unexpectedly moves during loading. That moment when you’re about to click a button and an ad loads above it, pushing everything down — that’s a CLS event.
Why it exists: Unexpected movement is disorienting and causes mis-clicks. On mobile, a high CLS score correlates strongly with user frustration and higher bounce rates.
How it works: The browser assigns a layout shift score to each unexpected movement, calculated by the fraction of the viewport that shifted multiplied by the distance elements moved. CLS is the sum of all layout shift scores that occur in clusters.
Thresholds:
| Score | CLS Value |
|---|---|
| Good | Under 0.1 |
| Needs Improvement | 0.1 – 0.25 |
| Poor | Over 0.25 |
What causes CLS:
- Images and videos without explicit width/height dimensions
- Ads, embeds, or iframes loading without reserved space
- Web fonts swapping in and causing text reflow
- Dynamically injected content (banners, cookie notices, popups)
Important constraint: CLS is calculated across the full page session in newer browser implementations (Session Window approach), so a popup that appears 10 seconds into a visit still affects your score.
How Google Actually Measures Your Core Web Vitals
Understanding the difference between lab data and field data is what separates surface-level optimization from real results.
Lab data is what tools like PageSpeed Insights, Lighthouse, and WebPageTest generate. They simulate a page load under controlled conditions — fixed network speed, specific device, single visit. Useful for diagnosing problems. Not what Google uses for ranking.
Field data is collected from real users visiting your site through Chrome. Google aggregates this into CrUX and updates it on a 28-day rolling window. This is what determines your Core Web Vitals status in Google Search Console and what influences your search rankings.
The practical implication: a site can score 90+ in PageSpeed Insights but still have “Poor” Core Web Vitals in Search Console if real users — particularly those on mobile or slower connections — consistently experience slow load times or layout shifts.
This is why checking your Core Web Vitals report in Google Search Console is more important than chasing a PageSpeed number. Search Console shows real-user data segmented by mobile and desktop, grouped by page type.
Soft CTA: If you want a professional audit of where your site actually stands on Core Web Vitals field data — not just a PageSpeed score — Marginseye Digital offers technical SEO reviews that cover real-user performance, crawlability, and ranking infrastructure. Get in touch here.
How to Improve Largest Contentful Paint (LCP)
LCP is typically the most impactful metric to work on because it’s directly tied to server response time and image delivery — both of which have large optimization headroom for most sites.
Optimize Your Server Response Time (TTFB)
Time to First Byte (TTFB) is how long the browser waits before it receives the first byte of data from your server. A slow TTFB delays everything downstream, including LCP.
Good TTFB is under 800 milliseconds. If yours is higher, the most effective interventions are upgrading hosting (shared hosting commonly causes high TTFB), enabling server-side caching, or implementing a Content Delivery Network (CDN) that serves cached pages from edge nodes geographically closer to your users.
For WordPress sites, plugins like WP Rocket or LiteSpeed Cache handle server-side caching. For custom sites, server-level caching (Nginx FastCGI cache, Varnish) is more reliable.
Optimize the LCP Image
First, identify your LCP element. PageSpeed Insights tells you exactly what element it flagged. Most of the time it’s a hero image.
Once identified:
- Convert to WebP or AVIF format. WebP typically reduces file size by 25–35% compared to JPEG with comparable quality. AVIF is smaller still but has slightly lower browser support. WebP is the safe default.
- Do not lazy load the LCP image. Remove
loading="lazy"from it. Addfetchpriority="high"instead to signal the browser to prioritize this resource. - Preload the LCP image in your
<head>:<link rel="preload" as="image" href="/hero.webp" fetchpriority="high"> - Use responsive images with
srcsetso mobile users aren’t downloading desktop-sized images.
Remove Render-Blocking Resources
CSS and JavaScript loaded in the <head> without defer or async force the browser to pause rendering until those files are downloaded and processed. This directly delays when LCP can paint.
Audit render-blocking resources in PageSpeed Insights under “Eliminate render-blocking resources.” The fix depends on the resource type:
- For non-critical CSS: Load it asynchronously or inline only the critical CSS needed for above-the-fold content.
- For JavaScript: Add
deferto scripts that aren’t needed immediately. Useasyncfor independent scripts like analytics tags.
How to Improve Interaction to Next Paint (INP)
INP is driven almost entirely by JavaScript behavior on the main thread. The browser can only do one thing at a time on the main thread — render the page, run scripts, respond to user input. When JavaScript tasks are long, user interactions have to wait.
Break Up Long JavaScript Tasks
A “long task” is any JavaScript task that takes more than 50 milliseconds. The browser can’t respond to user input while a long task is running, so the user experiences a delay — which accumulates into a poor INP score.
The fix is to break up these tasks using setTimeout, scheduler.postTask(), or by moving heavy computation to Web Workers. This yields control back to the browser between chunks of work, allowing it to respond to input faster.
Use Chrome DevTools’ Performance panel or the “Long Tasks” section in PageSpeed Insights to identify which scripts are causing the longest blocking periods.
Audit Third-Party Scripts
Third-party scripts — analytics, chat widgets, ad tags, heatmap tools, social embeds — are some of the most common sources of poor INP. They run JavaScript on your page that you don’t control, often blocking the main thread unpredictably.
Audit which third-party scripts are running and remove any that aren’t essential. For those you keep, load them with defer or after a user interaction trigger rather than on page load.
Reduce DOM Size
A large DOM (more than 1,400 elements is a common benchmark) makes rendering and style recalculation slower, which amplifies the effect of every JavaScript interaction. If your pages are generating very large DOMs, simplifying page structure or implementing virtual scrolling for long lists can help.
How to Fix Cumulative Layout Shift (CLS)
CLS is usually the most straightforward of the three metrics to address once you understand what’s causing the shifts.
Set Explicit Dimensions on All Images and Videos
The single most impactful CLS fix for most sites. When a browser encounters an image without explicit width and height attributes, it doesn’t know how much space to reserve — so it lays out the rest of the page, then shifts everything when the image loads.
Always include both attributes:
<img src="hero.webp" width="1200" height="630" alt="...">
For responsive images where the display size varies, use the CSS aspect-ratio property in combination with width: 100% so the browser can calculate the correct space before the image loads.
Reserve Space for Ads and Dynamic Content
Ads are one of the most common CLS culprits because they load asynchronously and push content down. The fix is to define minimum height containers for ad slots so the space is reserved before the ad loads.
The same principle applies to any dynamically injected content — cookie notices, newsletter bars, notification banners. Either load them from the server (so they’re in the initial HTML) or position them so they don’t push existing content — at the bottom of the viewport, or as overlays that don’t affect document flow.
Handle Web Fonts Carefully
When a browser loads a web font, it may initially display invisible text (FOIT) or fallback text in a different font (FOUT). When the custom font loads and swaps in, the text reflows — creating a CLS event if the fallback and custom font have different metrics.
Use font-display: optional or font-display: swap in your @font-face declarations. optional is more aggressive — it only uses the web font if it loads fast enough, otherwise it falls back permanently. This eliminates font-related CLS entirely at the cost of occasionally using the fallback font.
For critical fonts, use <link rel="preload"> to load them early and reduce the chance of a late swap.
Tools to Measure and Track Core Web Vitals
| Tool | Data Type | Best For |
|---|---|---|
| Google Search Console | Field data (CrUX) | Understanding your actual ranking signal |
| PageSpeed Insights | Both lab + field | Quick audits and issue identification |
| Chrome DevTools | Lab data | Deep debugging of specific issues |
| Web Vitals Chrome Extension | Field data (per visit) | Real-time monitoring during development |
| CrUX Dashboard (Looker Studio) | Field data | Historical tracking over time |
Search Console is the most important tool here because it shows your actual performance status — the data Google uses for ranking. Check the “Core Web Vitals” report under Experience. It segments issues by mobile and desktop and by URL group, so you can prioritize which page types to fix first.
Core Web Vitals Optimization Checklist
LCP
- [ ] Check and improve TTFB (target under 800ms)
- [ ] Identify your LCP element in PageSpeed Insights
- [ ] Convert LCP image to WebP or AVIF
- [ ] Remove
loading="lazy"from LCP image; addfetchpriority="high" - [ ] Preload LCP image in
<head> - [ ] Remove or defer render-blocking CSS and JS
INP
- [ ] Audit and break up long JavaScript tasks (>50ms)
- [ ] Defer or remove non-critical third-party scripts
- [ ] Reduce DOM size if over 1,400 elements
- [ ] Use Chrome DevTools Performance panel to trace main thread blockers
CLS
- [ ] Add explicit width and height to all images and videos
- [ ] Reserve space for all ad slots
- [ ] Prevent dynamic content (banners, pop-ups) from shifting document flow
- [ ] Set
font-display: optionalorswapfor web fonts - [ ] Preload critical fonts
Measurement
- [ ] Check Core Web Vitals report in Google Search Console
- [ ] Verify field data, not just lab scores
- [ ] Track mobile and desktop separately
Frequently Asked Questions
What is the difference between PageSpeed Insights score and Core Web Vitals?
PageSpeed Insights gives you a lab score (0–100) based on a simulated page load. Core Web Vitals are based on real user data collected by Chrome. Your score can look good while your actual Core Web Vitals status in Search Console shows “Poor.” Always prioritize field data.
Did Google replace FID with something new?
Yes. First Input Delay (FID) was replaced by Interaction to Next Paint (INP) in March 2024. INP measures responsiveness across the full page session, not just the first input. If you optimized for FID, those efforts weren’t wasted — but INP requires a broader focus on JavaScript performance throughout the entire visit.
How often does Google update Core Web Vitals data?
Google’s Core Web Vitals data is drawn from the Chrome User Experience Report (CrUX), which uses a 28-day rolling window. Changes you make today will take roughly 28 days to fully reflect in Search Console.
Does Core Web Vitals affect all websites equally?
No. Sites with high traffic have more CrUX data, which gives Google a more reliable signal. Low-traffic pages may not have enough field data to be assessed, in which case Google may fall back to lab data or group-level data from similar pages on your site.
My PageSpeed score is 90+ but my Search Console shows “Needs Improvement.” Why?
Lab scores simulate a single fast visit. Real users have varying device capabilities and connection speeds — particularly mobile users. Your 75th percentile real-user experience is what matters for your Search Console status.
What causes LCP to fail even after image optimization?
Common reasons: high TTFB (slow server response), the LCP image being lazy-loaded, render-blocking CSS delaying the first paint, or the LCP element being a CSS background image rather than an <img> tag (background images can’t be preloaded the same way).
How much does Core Web Vitals affect rankings?
Google has confirmed Core Web Vitals is a ranking factor, but it’s a tiebreaker-level signal — highly relevant content with poor CWV can still outrank mediocre content with excellent CWV. However, for competitive keywords where content quality is comparable, CWV can be the difference. It also directly affects bounce rate and conversion rate independently of rankings.
What is a good TTFB target?
Google’s guidance targets TTFB under 800 milliseconds. Under 200ms is excellent. Many shared hosting environments produce 1,000–2,000ms TTFB, which significantly limits LCP improvement regardless of image optimization.
Should I use a CDN to improve Core Web Vitals?
A CDN helps primarily with TTFB and LCP for users who are geographically distant from your origin server. If most of your traffic is local (e.g., predominantly Kenyan visitors on a server hosted in Nairobi), a CDN provides less benefit than upgrading your hosting or implementing server-side caching.
How do I check which specific pages are failing Core Web Vitals?
In Google Search Console, navigate to Experience → Core Web Vitals. The report groups failing URLs by issue type and page template. Click into specific issue groups to see example URLs. Cross-reference with PageSpeed Insights on those specific URLs to identify what to fix.
Conclusion
Core Web Vitals aren’t a one-time checklist — they’re an ongoing measurement of how real people experience your site. The most common mistake is treating a PageSpeed score as the goal. The real goal is what 75% of your actual users experience over the last 28 days.
The three things that matter most going into 2025: LCP is your loading reputation — optimize your server, your LCP image, and remove anything blocking the browser from painting it fast. INP is your responsiveness reputation — audit your JavaScript, reduce long tasks, and be ruthless about third-party scripts. CLS is your stability reputation — reserve space for everything that loads dynamically, set image dimensions, and handle fonts cleanly.
Get these right and you’re building a site that works for your users. That’s what Google’s measuring — and it’s also what keeps people on your pages long enough to become customers.
Next Read: The Hidden Benefits of SEO — What Most Businesses in Kenya Are Missing
Ready to find out exactly where your site stands?
Marginseye Digital provides technical SEO audits built around real-user performance data — not just PageSpeed scores. We work with businesses in Kenya and across East Africa to build search visibility that compounds over time.
Talk to us about your site →
